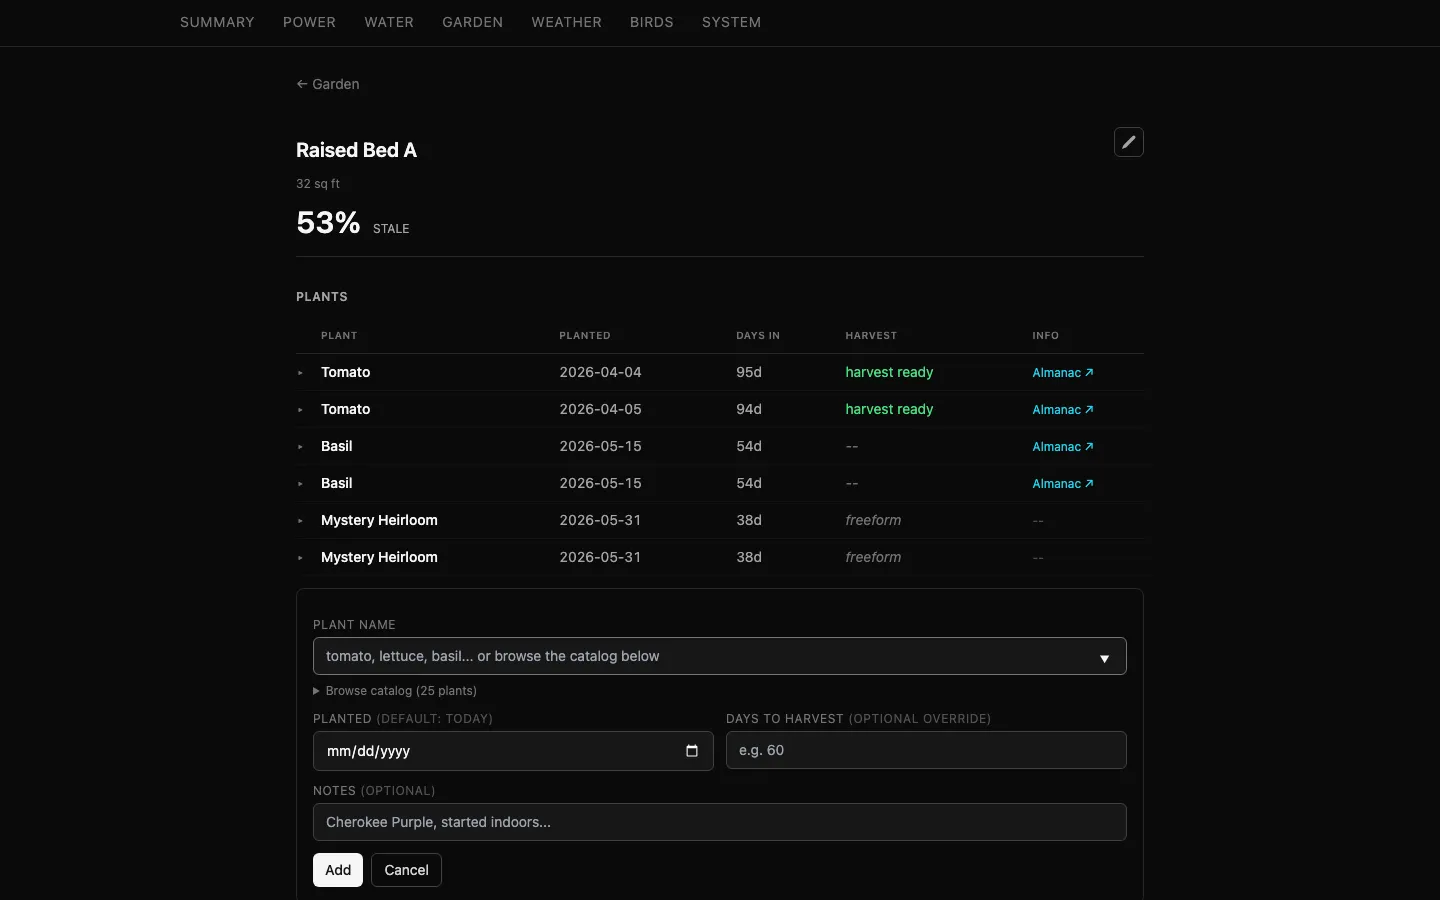
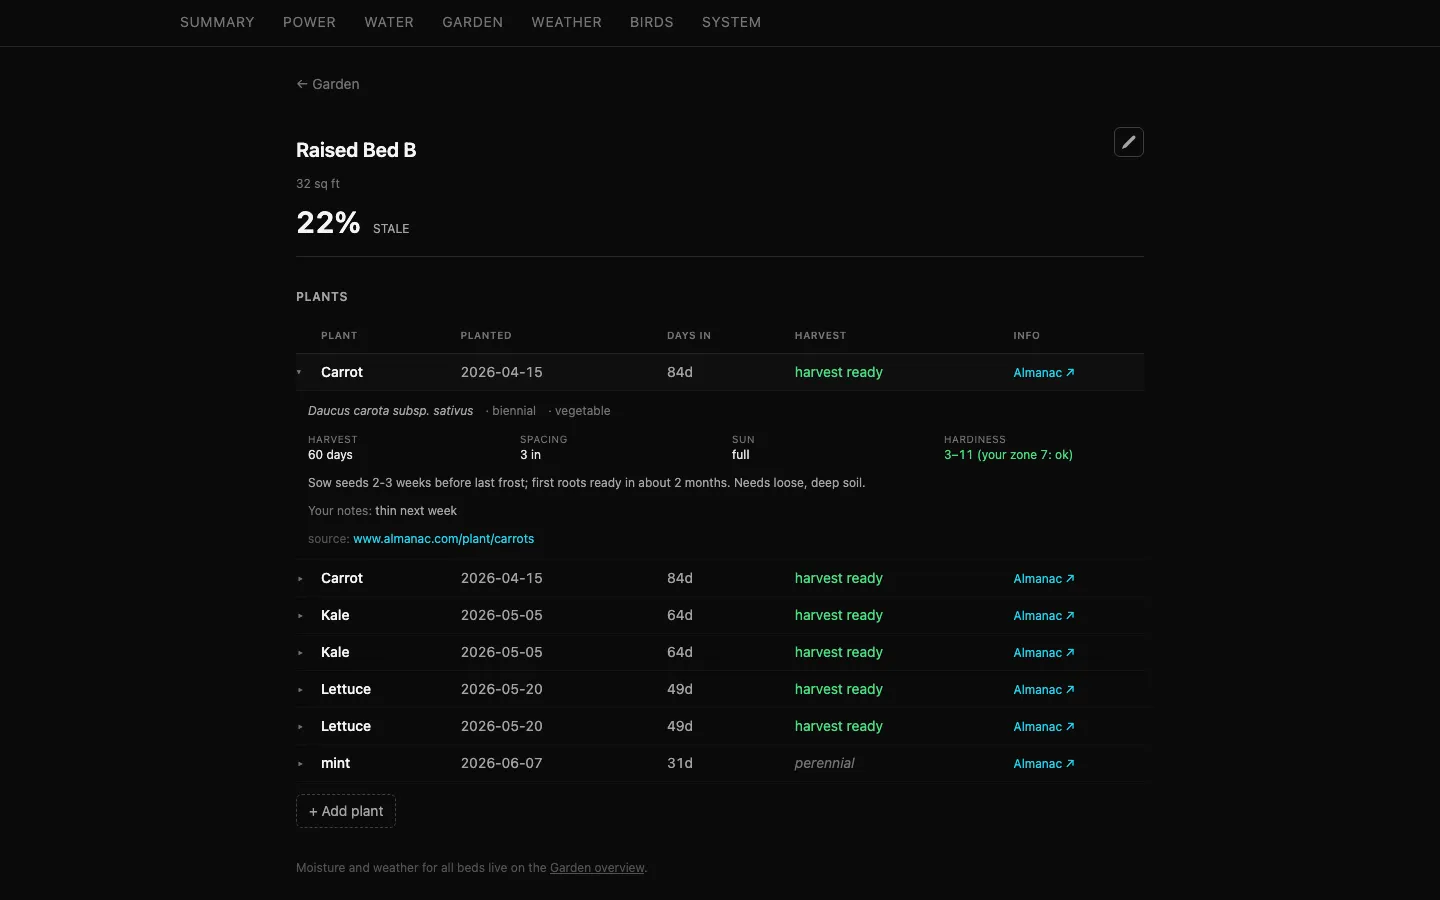
My house was already radiating data all day, power draw, water use, weather, birdsong, soil moisture, so I built a Raspberry Pi to catch it, and now it tells me which bird just landed in the yard and whether the solar panels are paying for themselves.
Everyone wanted a Mac Mini that year
I wanted to learn two things at once, how to run an always-on box for myself and what my own house's data looks like once someone bothers to collect it. A Mac Mini was the obvious pick for a home server, which is exactly why I could not get one. Everyone who had decided to run models on their own hardware instead of somebody's API wanted the same box, and the small ones were back-ordered or gone everywhere I looked. I went smaller. A Raspberry Pi is cheap enough to experiment on and small enough to leave running in a closet, and self-hosting was the itch either way.
Nothing on this Pi touches the internet
The naive version of this is easy. Point a Pi at some sensors and graph it. The hard part is making it trustworthy without making it boring. A bird detection model calls out a species from audio constantly and not every call is right, so the live feed had to stay exciting while the historical record stayed reliable, two different bars for the same stream.
Then there is the rule none of it could bend. The live feed shows when I am home and what is growing in my garden beds, so the only acceptable way to see it from my phone is over Tailscale, the private mesh network connecting the Pi, my Mac, and my phone. That rule is simple until the platform has to survive a reboot, grow a database for years on an SD card, and answer questions from an LLM, all without ever opening a port.
The rule is also what took the dashboard down for four days. It binds to the Pi's Tailscale address instead of listening on everything, and after one reboot the private network had not finished coming up when the dashboard went to claim its address, so it never started. I could have bound it to everything and firewalled it back, but that inverts the posture the whole project rests on. The dashboard now waits for the private network before it starts, while the database and ingestors boot immediately so collection never stops. That costs one more moving part living outside Docker Compose, and it buys a stalled network that fails loudly as a broken service instead of a dashboard that is quietly gone.
The same rule shaped the last piece. I wanted to ask the dashboard things it was not built to answer, like how closely the air conditioning tracked outdoor temperature, and that needs real SQL access. The hosted claude.ai connector was out, because it wants a public HTTPS endpoint. So I wrote a small MCP server that reaches the database over Tailscale only, from Claude Desktop and Claude Code, through a dedicated read-only Postgres role with no insert, update, delete, or DDL grants. It will never reach the claude.ai web app, which needs the public OAuth endpoint this project forbids itself.
The dashboard
Seven tabs, one for each thing I ended up measuring, laid out the way the dashboard is. They arrived in a different order as I built, power and water first, then weather, then birds, then the garden, then system health last, once everything else needed something to vouch for it.
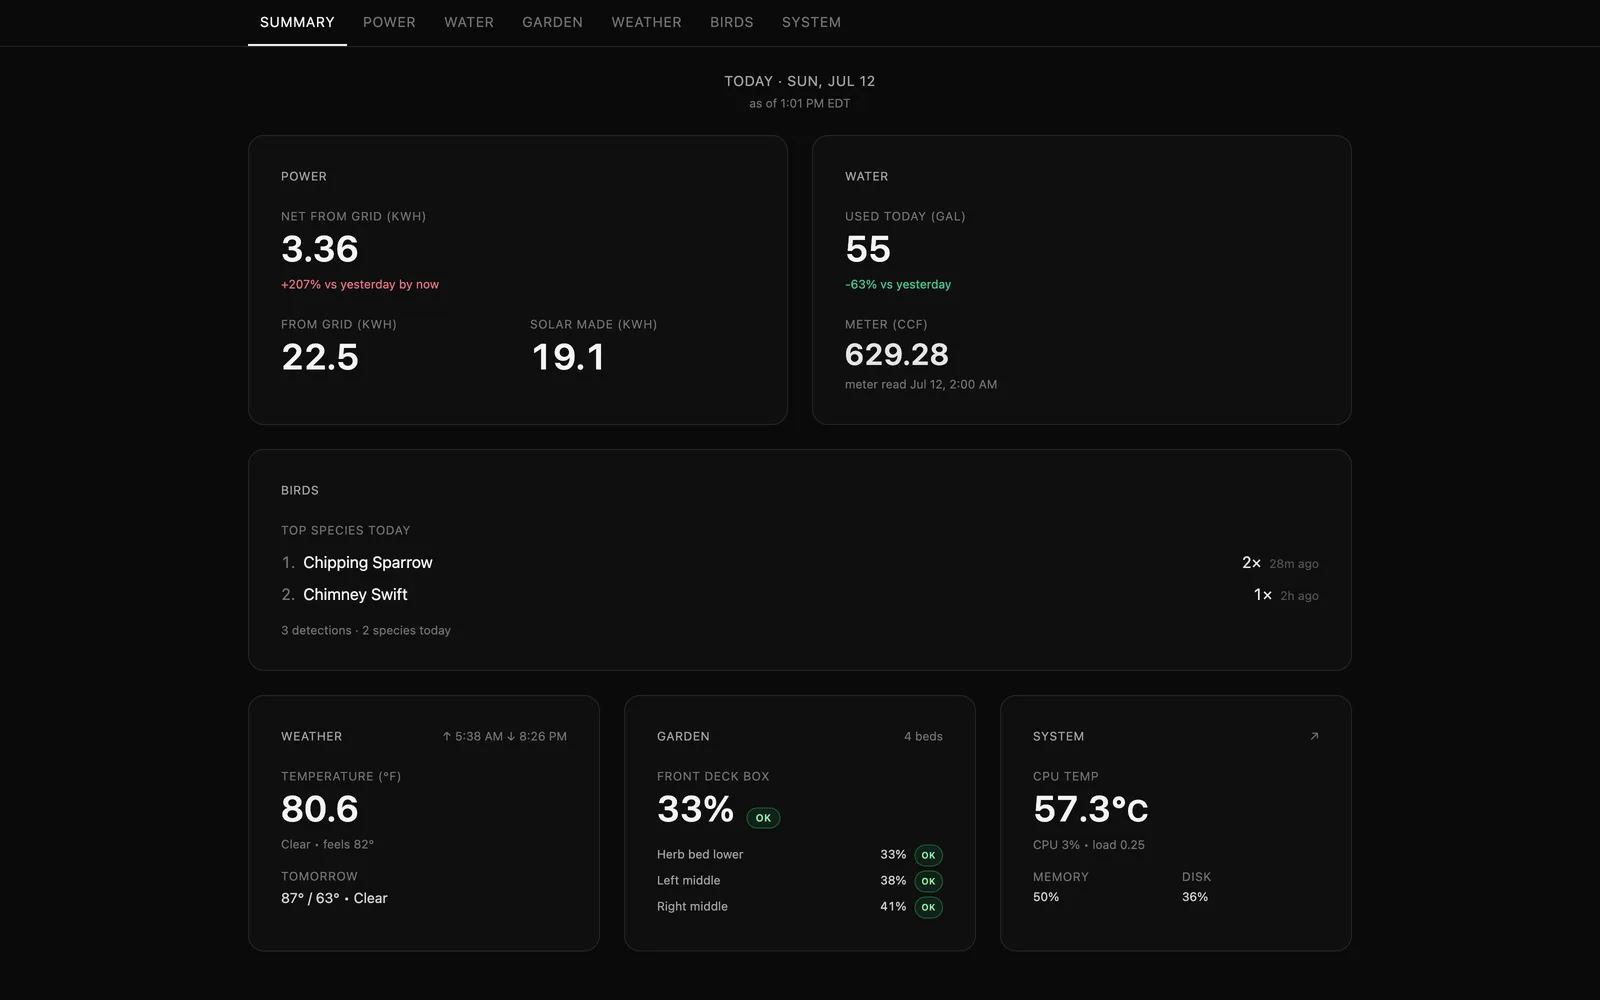
This is the screen I actually check. One card each for the streams that move fastest, and the whole point of the project compressed into a glance. If nothing here is surprising, the house is fine and I can put my phone down.
- data streams: power, water, weather, birds, garden, Pi vitals
- 6
- energy rows a year from one circuit monitor alone
- 33M
- USB microphone doing all the bird identification
- $70
- days the dashboard was dark before I found the cause
- 4
There is no second admin and no backup for the Pi's SD card beyond the GitHub remote holding the source. The MCP server is the newest piece, and I haven't yet asked it a real cross-domain question I couldn't answer by eye, which is its own kind of honest result. The plumbing works, I just haven't had a question that needed it.