Before UX and software, I spent years in environmental science: asbestos inspections, hazardous waste assessments, building sustainability audits, so I built a particulate sensor with no soldering iron to see if I could tie that old world to this one.
Question
The sensors and instruments from that first career had been background noise for years, ground I used to stand on professionally and hadn't touched since I moved into design and then into building software. I wanted to know if I could pick a real environmental sensor back up, this time as a UX designer turned product engineer, and get it talking to something I built myself. The condition I set going in was that I couldn't solder anything. I'd never touched an iron and didn't want my first attempt at it to be the thing standing between me and a working rig, so I looked for parts that would snap together instead: a Feather with its stacking headers already assembled, a sensor on its own breakout board. The real unknown was whether that design-to-engineering jump I'd already made in software would hold on ground I'd once worked professionally: could I, without soldering, capture real environmental data myself and build a software layer around it.
Experiment
I dug through sensor options until I found one I thought I could actually handle and build software around: a Plantower PM2.5 sensor, a blue metal box with a fan built into one face, sold on a breakout board that needed no soldering to wire in. I ordered it along with an assembled Adafruit HUZZAH32 ESP32 Feather, a half-sized 400-tie-point breadboard, a bundle of jumper wires, and a 3.7V 350mAh lithium-polymer battery with a short cable.
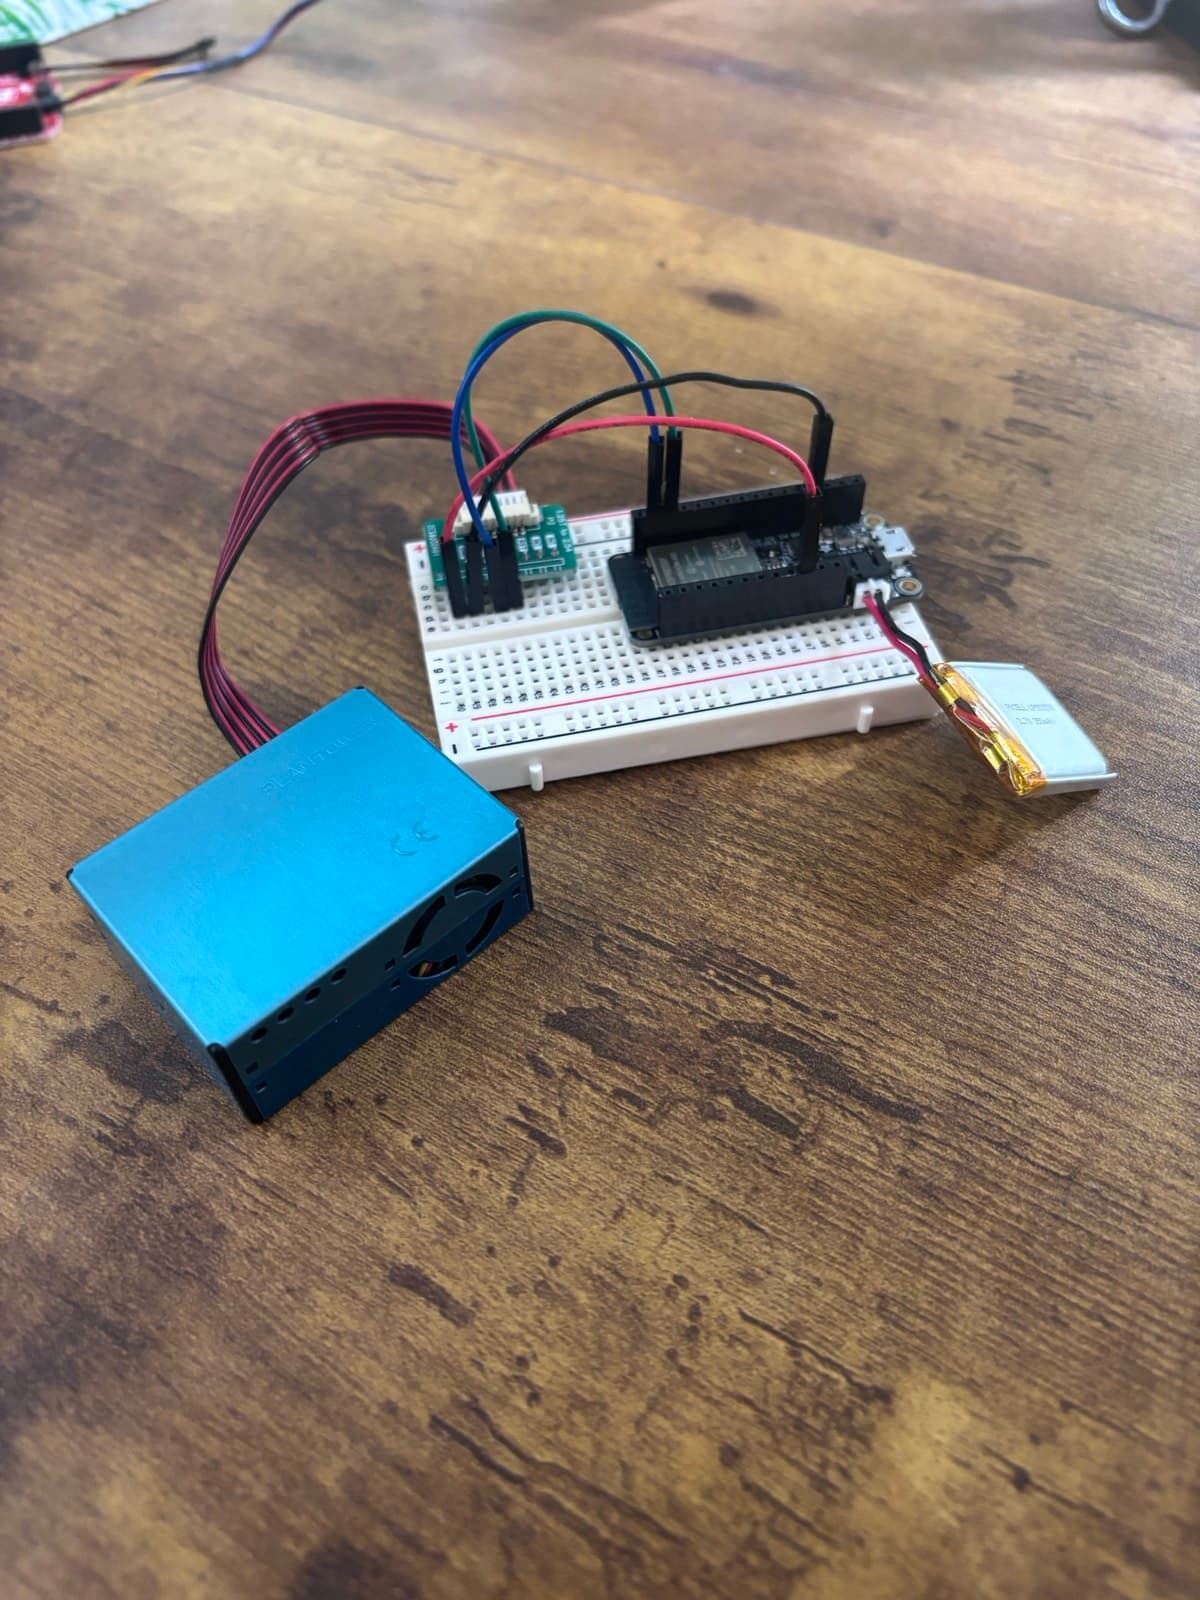
For the wiring and firmware sequence, both things I'd never done, I worked from an assembly guide Claude put together for me, the way I'd have followed a wiring diagram out of a manual.
The sensor connects to the Feather with exactly four jumper wires running from its breakout board into the breadboard's rows. Two are power: the breakout's VCC into the Feather's USB/5V pin, and ground into ground. The other two are data, and this is the part that actually taught me something: the sensor's TX pin goes to the Feather's RX pin, and the sensor's RX goes to the Feather's TX, on GPIO 16 and 17. Wire TX to TX and nothing happens, because that's two lines both trying to talk. Serial only works crossed, one side talking while the other listens, and until I wired it wrong once and stared at a blank feed, I hadn't actually understood that in my head.
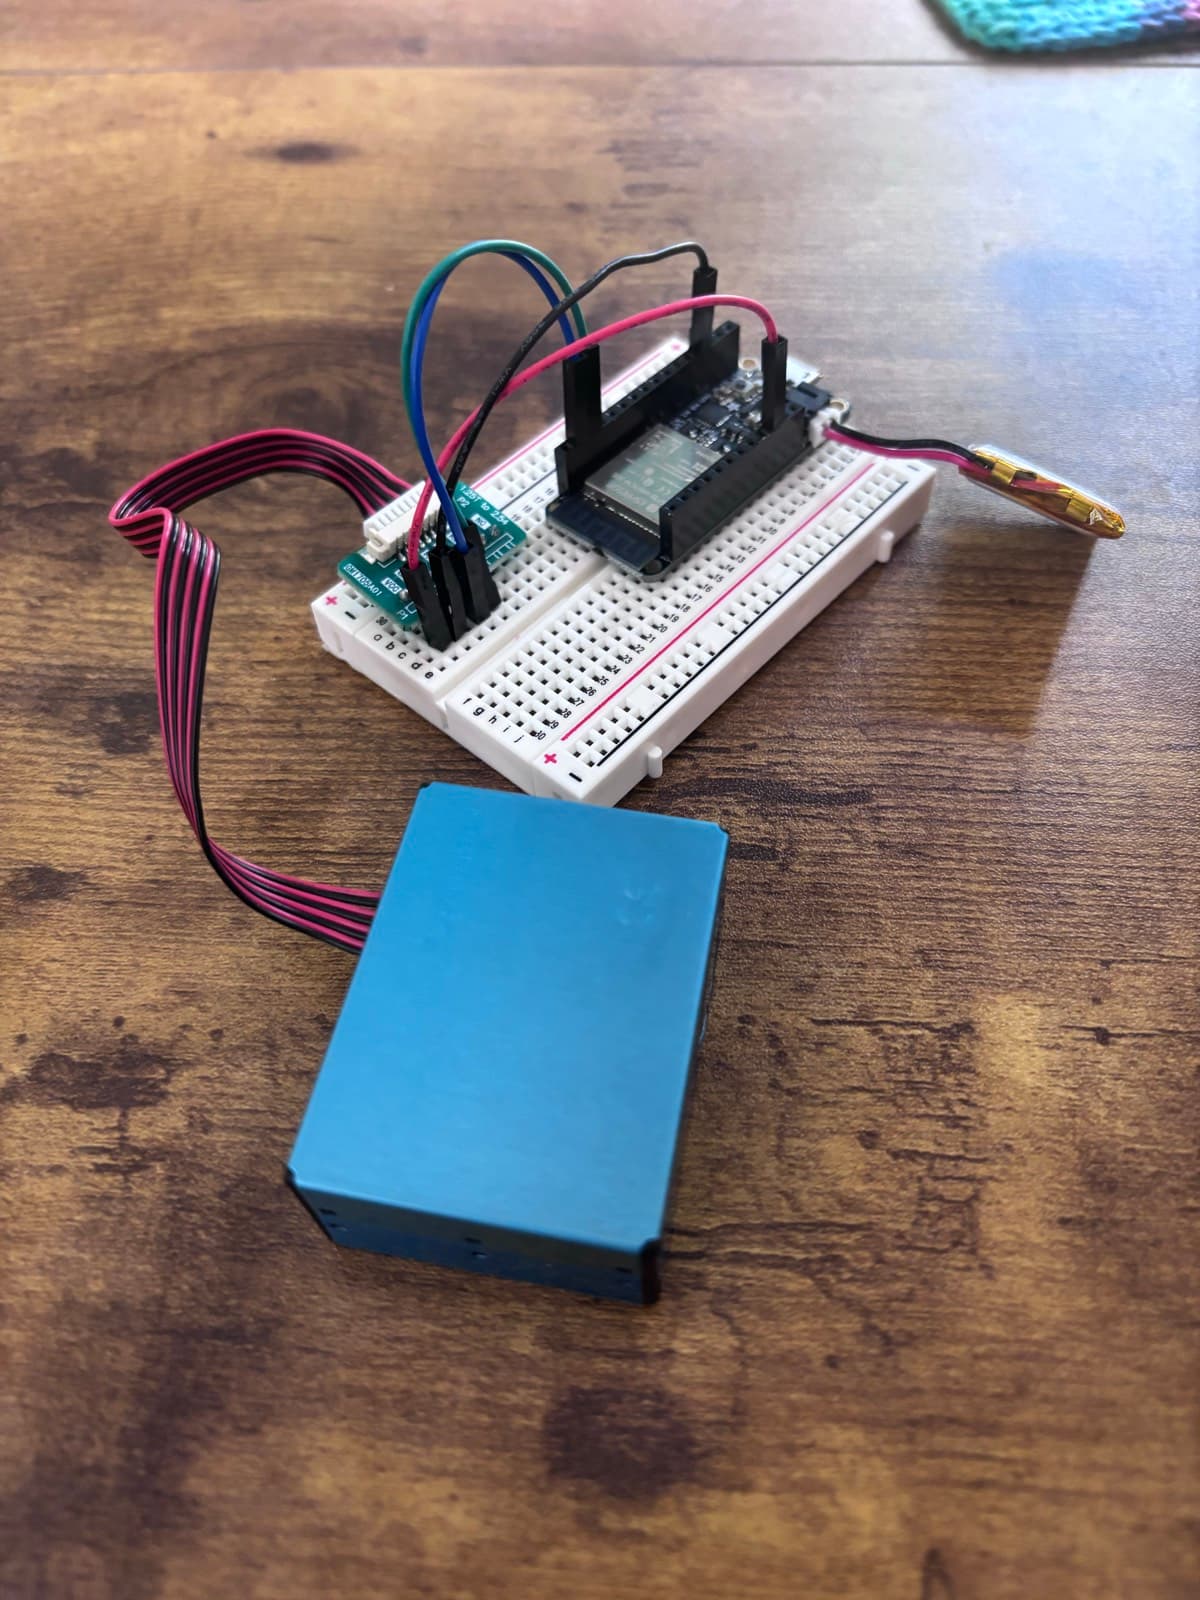
The Plantower's fan pulls air across an optical chamber inside, where a laser and a photodiode count particles by how much light they scatter, which is what turns into the PM1.0, PM2.5, and PM10 numbers on the other end.
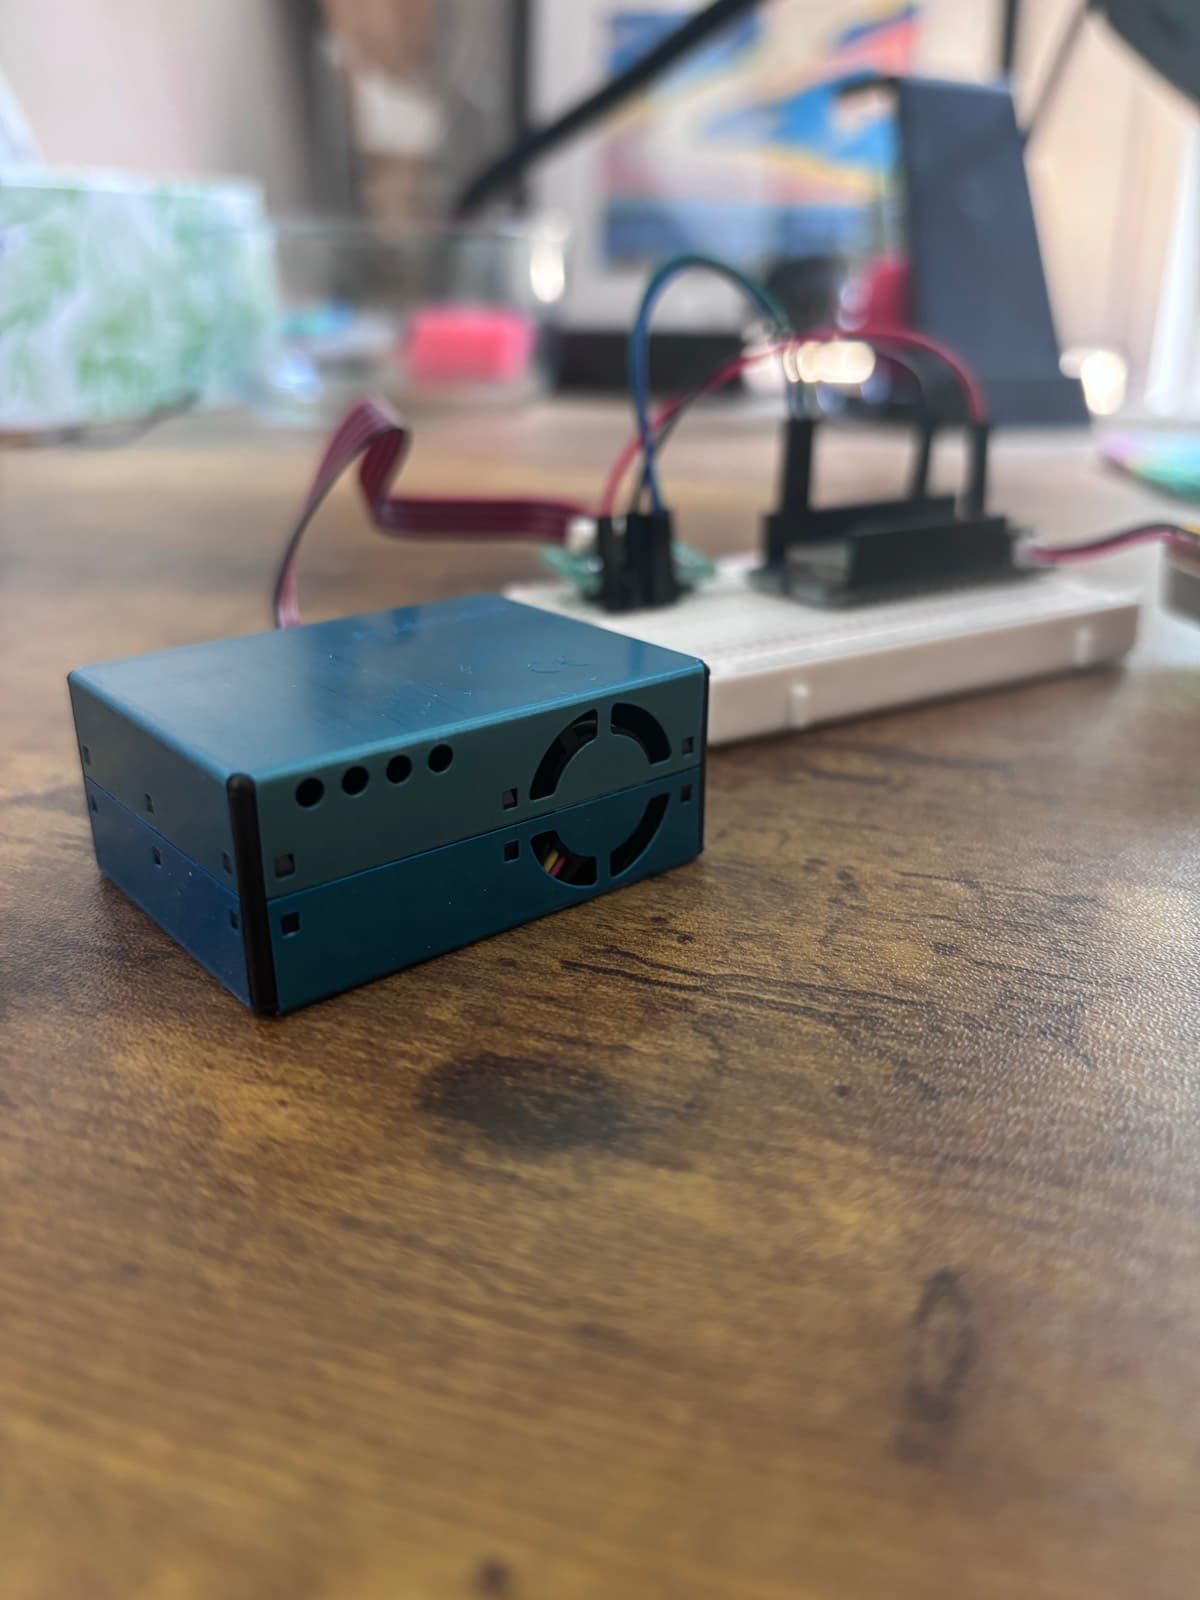
That fan is also why the LiPo battery, plugged into the Feather right there in the first photo, has never actually run the rig. The fan needs 5V to spin, and the Feather's 3.3V pin can't push that, so the sensor only works wired to the Feather's USB/5V input, which keeps the whole thing tethered to a USB cable for power. I bought a battery expecting a portable sensor and ended up with a rig that has never once run untethered.
On the firmware side, this is the Adafruit PM25AQI library talking to the sensor over hardware serial at 9600 baud on those same pins, 16 and 17, parsing out PM1.0, PM2.5, and PM10 on every read. Getting a number out of the chip that way is where the wiring stops mattering and the software problem starts: what to do with a raw reading once the Feather has one, and a Feather has no way to talk to an iPhone on its own.
A Feather posting sensor data has no direct channel to an iPhone, and I'd never written firmware before, so a paired Bluetooth link straight to the phone was off the table this early. 1Decision 01A Feather posting sensor data has no direct channel to an iPhone; the readings needed somewhere to land before an app could see them. Constraint: I'd never written firmware before, so anything requiring a Bluetooth stack on the microcontroller was more than I could take on this early. Chose: I had the Feather post PM1.0, PM2.5, and PM10 readings over WiFi to an Adafruit IO cloud feed roughly every 30 seconds, and built the app as a client of that feed instead of the sensor. Traded: Every reading takes an extra hop through Adafruit's servers, so the app is never reading the sensor directly, it's polling a cache. Raw PM2.5 numbers needed to become the AQI scale people actually recognize, and the Feather firmware was the wrong place to iterate on a conversion formula I didn't understand yet. 2Decision 02Raw PM2.5 in micrograms per cubic meter means nothing to a reader used to the AQI scale on a weather app, and the Feather firmware was the wrong place to iterate on a formula I was still learning. Chose: I left the Feather dumb, posting only raw PM numbers, and wrote the EPA's piecewise AQI conversion in Swift, inside the app. Traded: The Feather can't compute or show AQI on its own; the conversion, and any future fix to it, exists only on the phone. The sensor itself has no GPS and no fixed-location record in Adafruit IO, so the app's Map tab had nothing to plot a reading against. 3Decision 03The sensor has no GPS and Adafruit IO stores no location, so the Map tab had nothing to plot a reading against. Chose: The app tags each reading with the phone's GPS location at the moment it's fetched, then pins the peak reading recorded at that spot. Traded: A reading is geotagged to wherever my phone was when the app pulled it, not to the sensor, so the map is only accurate if I'm actually near the sensor when I check the app. The Insights tab needed to say something more useful than a bare chart, and the easy move would have been to call anything statistical AI. 4Decision 04The Insights tab needed to say something more useful than a bare chart, and it would have been easy to label plain statistics as AI to sound more capable than the code is. Chose: Insights runs plain summary statistics and a local-maximum peak detector: a reading counts as a peak if it beats both neighbors and clears 10 micrograms per cubic meter. I labeled it exactly that, not AI. Traded: It can't predict anything or explain why a peak happened, it only describes what the data already did.
The pipeline runs end to end: the sensor posts to Adafruit IO, and a five-tab SwiftUI app pulls the feed. Dashboard shows a live AQI ring, a sparkline, and a small particle animation tied to the current reading. History charts all three PM channels with Swift Charts. Map pins peak readings where GPS placed the phone when they happened. Insights holds the honest statistical summaries above. Settings and a full onboarding flow round it out. Under the hood it's MVVM with protocol-based dependency injection across roughly 77 Swift files: an AdafruitIOService pulling the feed, a FirestoreService syncing readings to Firebase per signed-in user, Sign in with Apple for auth, a LocationManager for the GPS tags, an AQICalculator running the EPA formula, a StatsService backing Insights, and a KeychainService for credentials. The README runs 298 lines with setup and troubleshooting notes, including a real bug it admits to: PM1.0 and PM10 currently share PM2.5's trend line in History.
- tabs: dashboard, history, map, insights, settings
- 5
- Swift files, MVVM with protocol-based DI
- ~77
- posting interval, sensor to Adafruit IO
- 30s
- line README with setup and troubleshooting
- 298
Learning
The hardware taught me things no diagram could: I can read a breadboard's rows and columns now, and cross a TX/RX pair without stopping to work out which side talks and which side listens. But the rig never got past a proof of concept in the literal sense. With the fan needing 5V that the Feather's 3.3V pin can't supply, the 350mAh battery I bought for portability has never once run the sensor untethered from USB. The whole build stayed one breadboard deep, four wires and one sensor, while the software went five tabs deep on top of it. That gap between how far the hardware went and how far the software went is the honest shape of this project.
It answered the question I started with. I could pick environmental science back up, wire a sensor with no soldering iron, get real readings into the cloud, and build software that made them legible. I later scaled that same loop, sensor to cloud to app, into e-pi, a Raspberry Pi that now tracks six data streams instead of one. This particulate sensor was the small, low-stakes version that proved I could do it at all.
Stack
- Adafruit Feather
- Adafruit IO
- Swift
- SwiftUI
- Swift Charts
- Firebase
- Sign in with Apple